


The Consumer Price Index for Sint Maarten has increased in the month of June 2017 by 0.5 percent compared to that of April 2017. When comparing average consumer prices over a twelve month period (June
2016 to June 2017) an inflation rate of 1.4% is recorded. This is evident from the data released by the Department of Statistics (STAT) today.
Price changes between June and April 2017
The Consumer Price Index for Sint Maarten has increased in the month of June 2017 by 0.5 percent compared to that of April 2017. The price index recorded in June 2017 is 129.3
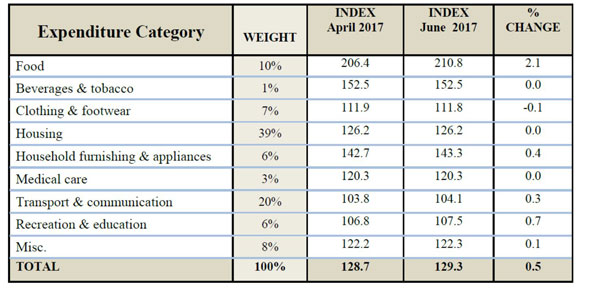
Expenditure Categories – overall increase
In June 2017, five of the nine expenditure categories recorded positive percentage changes (prices increased), one was negative (price decreased) and three remained stable. Prices increased in: ‘Food’ (+2.1%), ‘Household Furnishing & Appliances’ (+0.4%), ‘Transport & Communication’ (+0.3%), ‘Recreation & Education’ (+0.7%) and ‘Miscellaneous’ (+0.1%). Whereas, a decrease was recorded for the expenditure category ‘Clothing & Footwear’ (-0.1%). The expenditure categories: ‘Beverages & Tobacco’, ‘Housing’ and ‘Medical Care’ remained constant.
Food
FOOD EXPENDITURE CATEGORY
10% of CPI
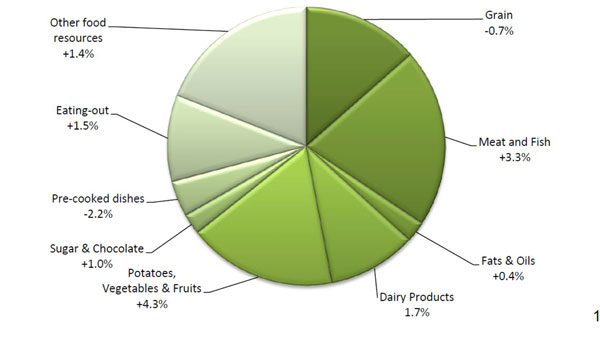
Within the Food category, seven of the nine sub groups became more costly, while two were less expensive. The following groups recorded increases: Meat and Fish (+3.3%), Fats & Oils (+0.4%), Dairy Products (+1.7%), Potatoes, Vegetables & Fruits (+4.3%), Sugar & Chocolate (+1.0%), Eating-out (+1.5%) and Other Food Resources (+1.4%), while Grain (-0.7%) and Pre-cooked Dishes (-2.2%), became cheaper.
More specifically, certain products within the Food subgroups largely influenced the total price change of the Food category. Hence, the group ‘Grain’ was influenced by white rice (-3.5%), cornflakes and rice flakes (-2.3%) and spices (-13.3%). The group ‘Meat & Fish’ was impacted most by: beef (+24.3%), pork chops (-3.8%), spareribs (+3.9%), Ham (+21.9%), chicken & chicken organs (+0.9%), pigtail (-7.4%) and canned salmon (+12.5%). The largest influence of the ‘Dairy Products’ was eggs (+3.3%).
The price change of the subgroup ‘Potatoes, Vegetables & Fruits’ was largely due to:
Fresh potatoes (-9.8%), leafy greens (-8.2%), cole crops (+6.8%), garlic and onions (-1.8%), sweet peppers (-2.9%), other fruit vegetables (-7.2%), fresh culinary herbs.(+31.1%), apples and pears (+4.3%), grapes and prunes (+2.8%), oranges (+6.4%), plantain (+5.0%), fresh fruit n.e.c3 (+38.3%), and raisins and currants (+9.7%).
Housing
HOUSING EXPENDITURE CATEGORY
39% of CPI
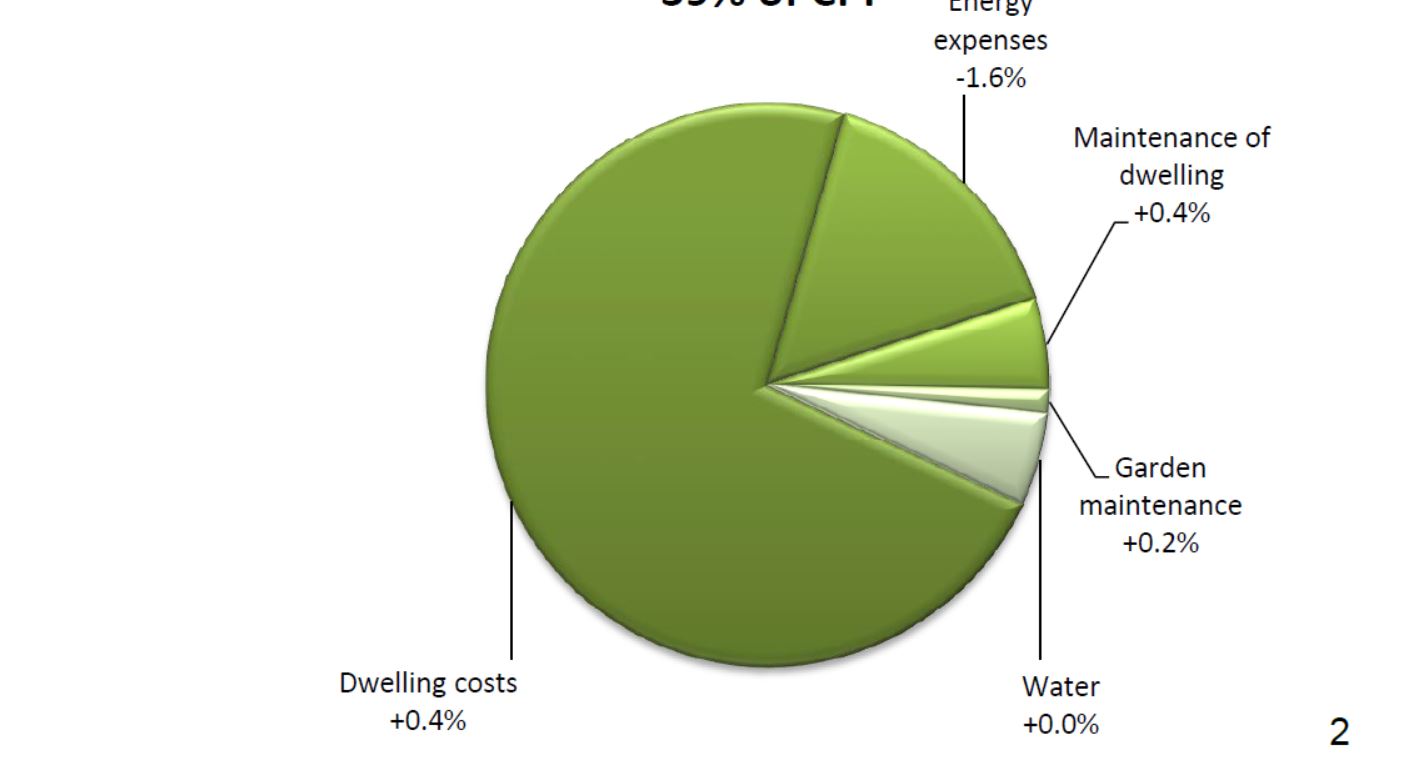
Within the Housing category, it was noted that three of the five product groups became more expensive, one became less expensive and one remained stable. The product groups: ‘Maintenance of Dwelling’, ‘Garden Maintenance’ and ‘Dwelling Costs’ increased by +0.4%, +0.2% and +0.4% respectively, while there was a drop in ‘Energy Expenses’ (-1.6%).
A decrease in the consumer price of electricity by 1.9 % largely influenced the total price change within the product group ‘Energy Expenses’, while ‘Maintenance of Dwelling’ was impacted most by blocks, water pipes and faucets (+1.5%).
Transport & Communication
TRANSPORTATION AND COMMUNICATION EXPENDITURE CATEGORY
20% of CPI
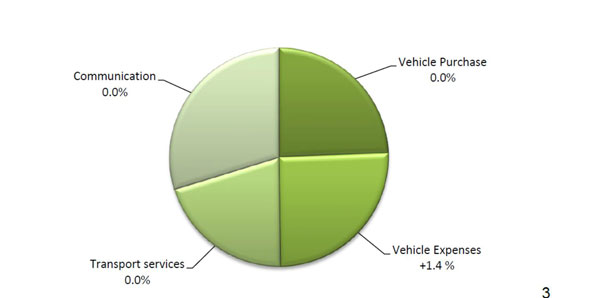
Of the four product groups within the Transport & Communication category, only ‘Vehicle Expenses’ recorded a price change, namely an increase of 1.4%. This group was influenced by engine parts (+3.7%), car tires (-4.4%), car batteries (+6.0%), gasoline (+4.3%) and extra expenses (-11.1%).
Sint Maarten Consumer Price Index a Broader Perspective
Though the trend over the past 3-year period depicts gradual increasing consumer prices, we note that prices have steadily declined during the period August 2015 through to April 2016; this is evident in the bar chart below. However, thereafter up to the current period (June 2017), there is a steady increase of the index, despite the slight drop in February 2017. Thus, over the last 3 years, consumer prices have shown some volatility, but seem to be gradually increasing.
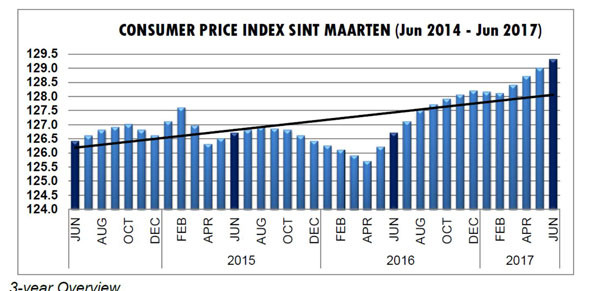
3-year Overview
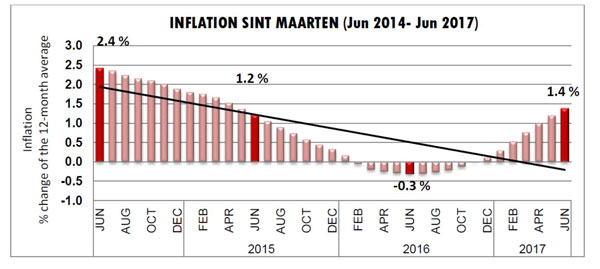
The trend line below indicates that inflation on Sint Maarten over the prior 3-year period has been declining. It can be noted however, that the rate of inflation since December 2016 has gradually began to increase, recording 1.4% in June of this year.
Inflation Sint Maarten April 2017
The 12-month average of consumer prices in June 2017 is 1.4% higher than one year ago. This represents an increase of 1.7 percentage points when compared to average prices in the same period last year.
Inflation on Sint Maarten for the Major Expenditure Categories
Inflation for the Major Expenditure Categories.
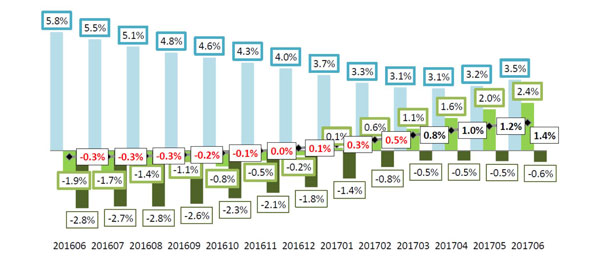
There are nine Household Expenditure Categories used to calculate the CPI. Three of these account for 69% of the total household expenditure: Housing (39%), Transportation & Communication (20%) and Food (10%).
Analysis of the monthly figures of these categories showed that inflation has steadily decreased in the Food category, but is now showing an increase. Deflation has been maintained in the Transport & Communication category. It should be highlighted that the average price development in the Housing category during the last six months have recorded inflation.
The monthly developments amongst the three major expenditure categories are illustrated in the bar chart above.