


PHILIPSBURG:--- The Consumer Price Index for Sint Maarten has decreased in the month of February 2017 by 0.1 percent compared to that of December 2016.
When comparing average consumer prices over a twelve month period (February 2016 to February 2017), compared to one year earlier, an inflation rate of 0.5% is recorded.
This is evident from the data released by the Department of Statistics (STAT) today.
Price changes between February 2017 & December 2016
The Consumer Price Index for Sint Maarten has decreased in the month of February 2017 by 0.1 percent compared to that of December 2016. The price index recorded in February 2017 is 128.1
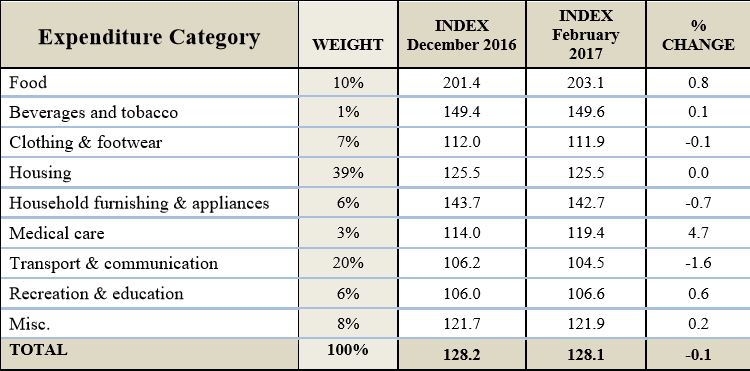
Expenditure Categories – overall decrease
In February 2017, five of the nine expenditure categories became more expensive, three became less expensive and one remain unchanged. Amongst the more expensive were the categories; ‘Food’ (+0.8%), ‘Beverages and Tobacco’ (+0.1%), ‘Medical Care’ (4.7%), ‘Recreation & Education’ (0.6%), and ‘Miscellaneous’ (0.2%). Whereas decreases were recorded for the expenditure categories; ‘Clothing and Footwear’ (-0.1%), ‘Household furnishing & appliances’ (-0.7%), and ‘Transport & Communication’ (-1.6%). The expenditure category ‘Housing’ remained stable.
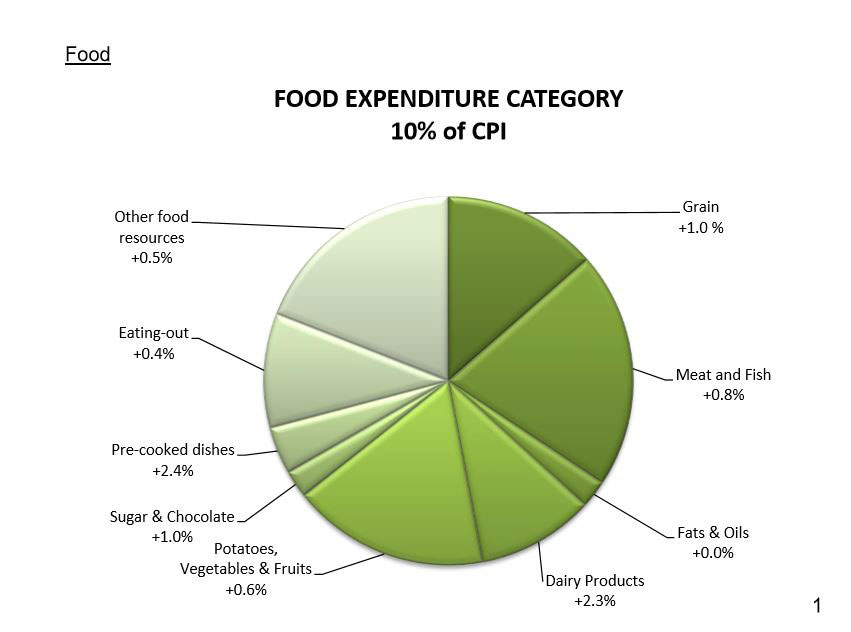
Within the expenditure category Food, it can be noted that eight of the nine food groups became more expensive and one remained unchanged. The following food groups recorded increases; Grain (+1.0), Meat and Fish (+0.8%), Dairy Products (+2.3%), Potatoes, Vegetables & Fruit (+0.6%), Sugar & Chocolate (+1.0%), Pre-cooked dishes (+2.4%), Eating-out (+0.4%), other food resources (+0.5%), while Fats & Oils showed no change.
More specifically the following products largely influenced the total price change within the food groups: ‘Grain’, this was largely influenced by small breads n.e.c.2 (+8.0%). The food group ‘Meat & Fish’, was largely influenced by beef (+6.4%), pork chop (with and without bone) +5.3%, Spareribs (6.6%), pork meat n.e.c. (-7.1%), chicken and chicken organs (+2.3%) other fish n.e.c. (-2.0%). The food group ‘Dairy Products’ was largely influenced by; canned milk (-2.0%), and eggs (+28.2%). The food group ‘Potatoes, Vegetables & Fruit’ was largely influenced by; cabbage (+14.4%), carrots and garlic (+8.1%), onions (+2.9%), tomatoes (-4.1%), paprika (-6.5%), fresh herbs (-7.4%), other fresh vegetables (+16.8%), fresh vegetables n.e.c. (-7.4%), frozen vegetables (-26.3), apples and pears (-4.4%), other citrus fruit (+6.2%) and fresh fruit n.e.c (+5.8%). The food group ‘Pre-cooked dishes’ was largely influenced by desserts and salads (+20.7). The food group ‘Other foods n.e.c.’ was largely influenced by tomato ketchup (+5.7%) and other sauces (-4.2%).
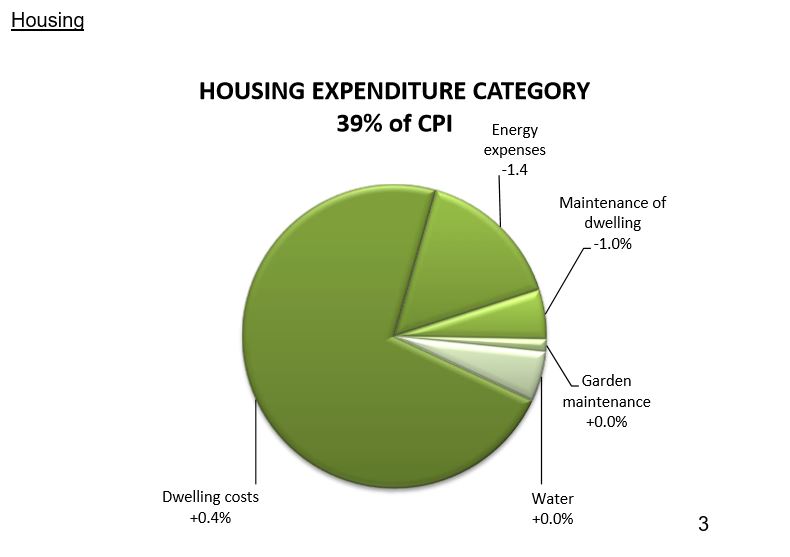
Within the expenditure category Housing, it is noted that just one of five product groups became more expensive, while two became less expensive and two were unchanged. The product group ‘Dwelling costs’ increased by +0.4%, while ‘Energy expenses’ and ‘Maintenance of dwelling’ decreased by -1.4% and -1.0% respectively.
A decrease in the consumer price of electricity by -1.3% largely influenced the total price change within the product group ‘Energy expenses’, and a decrease in the consumer price of paint by -2.9% impacted the Product group: ‘Maintenance of dwelling’.
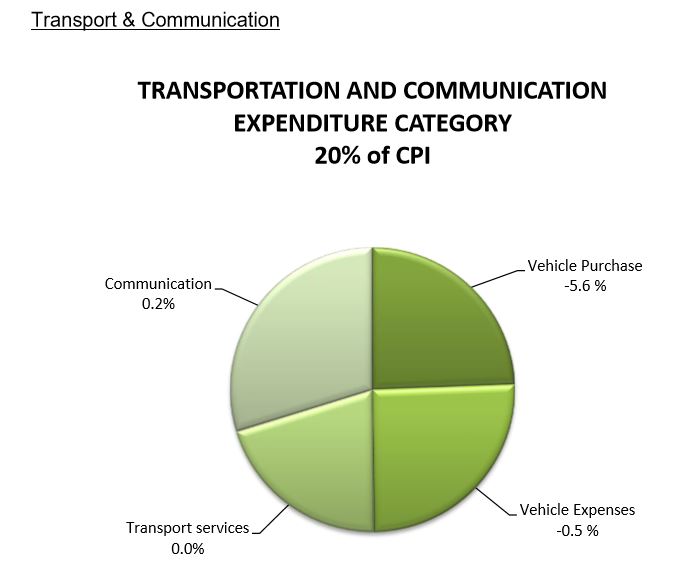
Within the expenditure category Transport & Communication, one of four product groups became more expensive, one remained stable and two were less expensive. The product group ‘Vehicle Expenses’ recorded a price change, namely a decrease of -0.5%. The price change amongst the products; car parts (-9.7%), tires (+6.4%), batteries (-25.4%) and gasoline (+6.1%) largely influenced this product group.
Sint Maarten Consumer Price Index a Broader Perspective
Though the trend over the past 3-year period depicts gradual increasing consumer prices; we note that prices have steadily declined during the period August 2015 through to April 2016; this is evident in the bar chart below. Significant is the steady increase of the index during the latter part of 2016 and stabilization at the start of 2017. Over the last 3 years; consumer prices have shown quite some volatility, but seem to be edging back upwards, with this trend holding through in 2017.
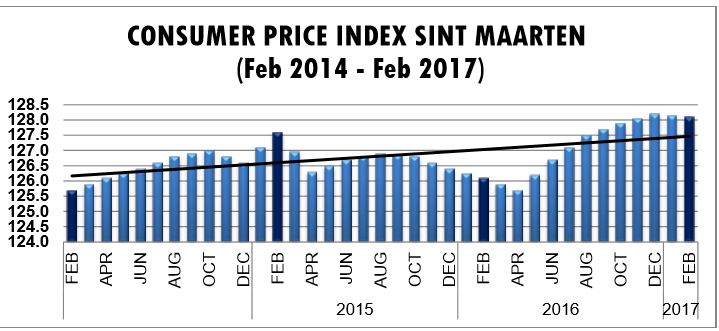
3-year Overview
The trend line below indicates that inflation on Sint Maarten over the prior 3-year period has been declining. Noteworthy, however, is that the rate of inflation since December 2016 is above 0.
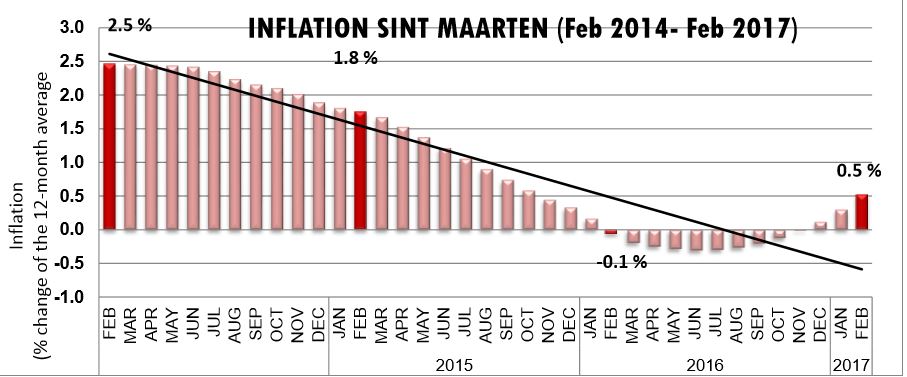
Inflation Sint Maarten February 2017
The 12-month average of consumer prices in February 2017 is 0.5 percent higher than a year earlier, an increase of 4 percentage points.
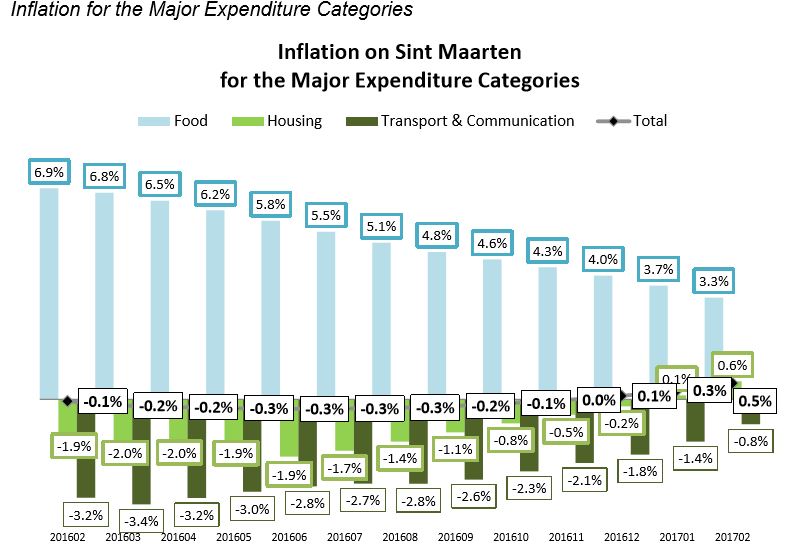
Three of the nine expenditure categories account for 69 percent of Household expenditure; these are ‘Housing’ (39%), ‘Transportation and Communication’ (20%) and ‘Food’ (10%). When looking at the monthly developments of inflation amongst these categories we note that Food inflation has continued to drop, deflation has been maintained in the Transport & Communication category while inflation has returned in the Housing category during the last two months.
These monthly developments are illustrated in the bar chart above.